
I decided to create a simple project that would marry my love for music and my addiction to Twitter and Spotify. So let us imagine that we work for a record company. A particular team in this company is really interested in 10 artists. They would love to know the weekly trend of followers on both Spotify and Twitter. This would help inform their social media or marketing decisions. So they reached out to the analytics and engineering team to come up with an automated routine that would update these figures on a nightly basis and provide a chart and update chart.
So to tackle this I decided to use some AWS resources and this very web site. I figured I could keep this super light weight (no need for Airflow or a database here).
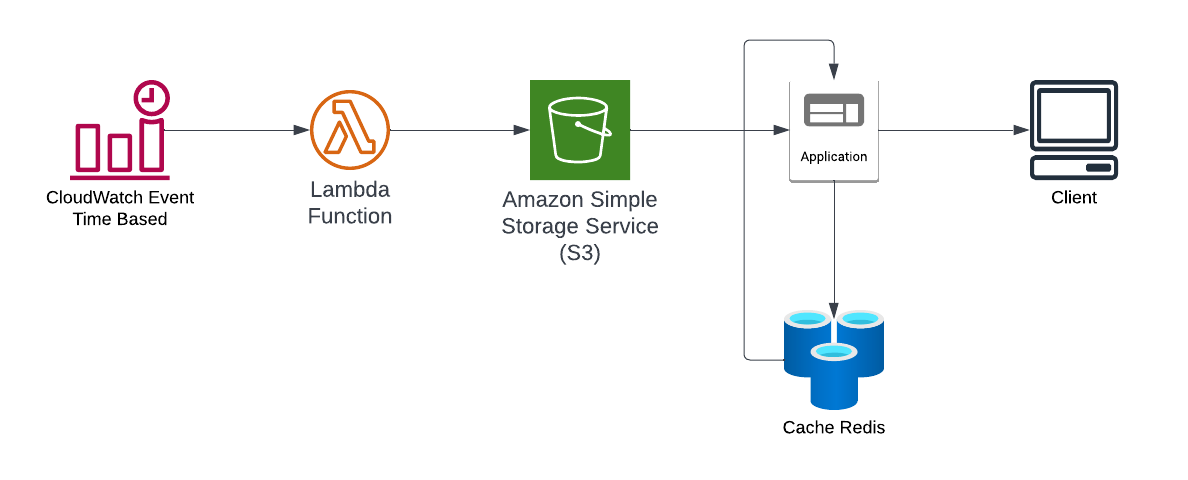
below is the design I went for. The code for this project is located here.
The first step was to create a python script that follows the basic logic below for each artist. Note that basic requests library was used for getting Spotify data and tweepy was used for accessing Twitter data.
Then once all the data is captured, a json object is constructed that represents the data for the current date. The json object looks like:
This encapsulates the core logic. As we will see in the next section, this will be wrapped into an AWS Lambda function so that we can have a lightweight and modern way of accessing the needed data on a desired cadence.
The logic from the previous section is encapsulated in the AWS Lambda function lambda_function.py. Additionally, the script create_lambda_resources.py is summarized well by it's main function. In other words, it does the following:
Now that we have data available in S3 we can use our Flask web application to display the data. The goal here is
to just present a plot that displays follower count data for the last 7 days. I made this real simple by creating a little REST API and utilized Redis to
cache the data so that repeated access to the data is fast. I utilized the restx
library to create this endpoint.
What this endpoint does is take in an artist name, fetches the last 7 days worth of data and reformats the data so that the keys are dates and the values
are nested json of Spotify and Twitter follower values that looks like:
And then we end up with is nicely formatted data that we can use to chart each artist's 7 day trend. Below shows both the HTML setup
(dropdown menu and available plot cavas) as well as the javascript that handles the plotting.
I used the chart.js library here. We see here that the page loads by default with "Dream Theater" being
selected and plotted. Based on the drop down selection the getData function is
called which then calls the plot function with artist as an argument. Data is fetched from the Flask API. The data is consumed and
reformatted so that two line plots (one Twitter and one Spotify) can be overlayed.
Finally the team can view their data, which will auto-update nightly and provide the last 7 day trend!
***Note - now that Twitter will be charging for access to their API, this project was brought down. Below is data for 1/1/2023-1/7/2023 read from AWS S3.